So what does it all mean? – Part 5 – Summaries
In this fifth part of the “so what does it all mean” series I’ll share early experience with care record summaries. As a recap to the preceding parts:
- looked at the design of the paper that GPs have written their records on until recently – the Lloyd George record;
- looked at the content of historical hospital attendance records from Great Ormond Street;
- then looked at the ReSPECT paper form from the resuscitation society for end of life care preferences; and
- brought these together with a look at the electronic representation of data with three different approaches.
So, in this part, I’m sharing work I did over 20 years ago to bring records from a variety of different databases and systems to form a summary record. There are many occasions where understanding all the record and full clinical history are incredibly value. There are, however, many occasions where a summary would be “good enough”.
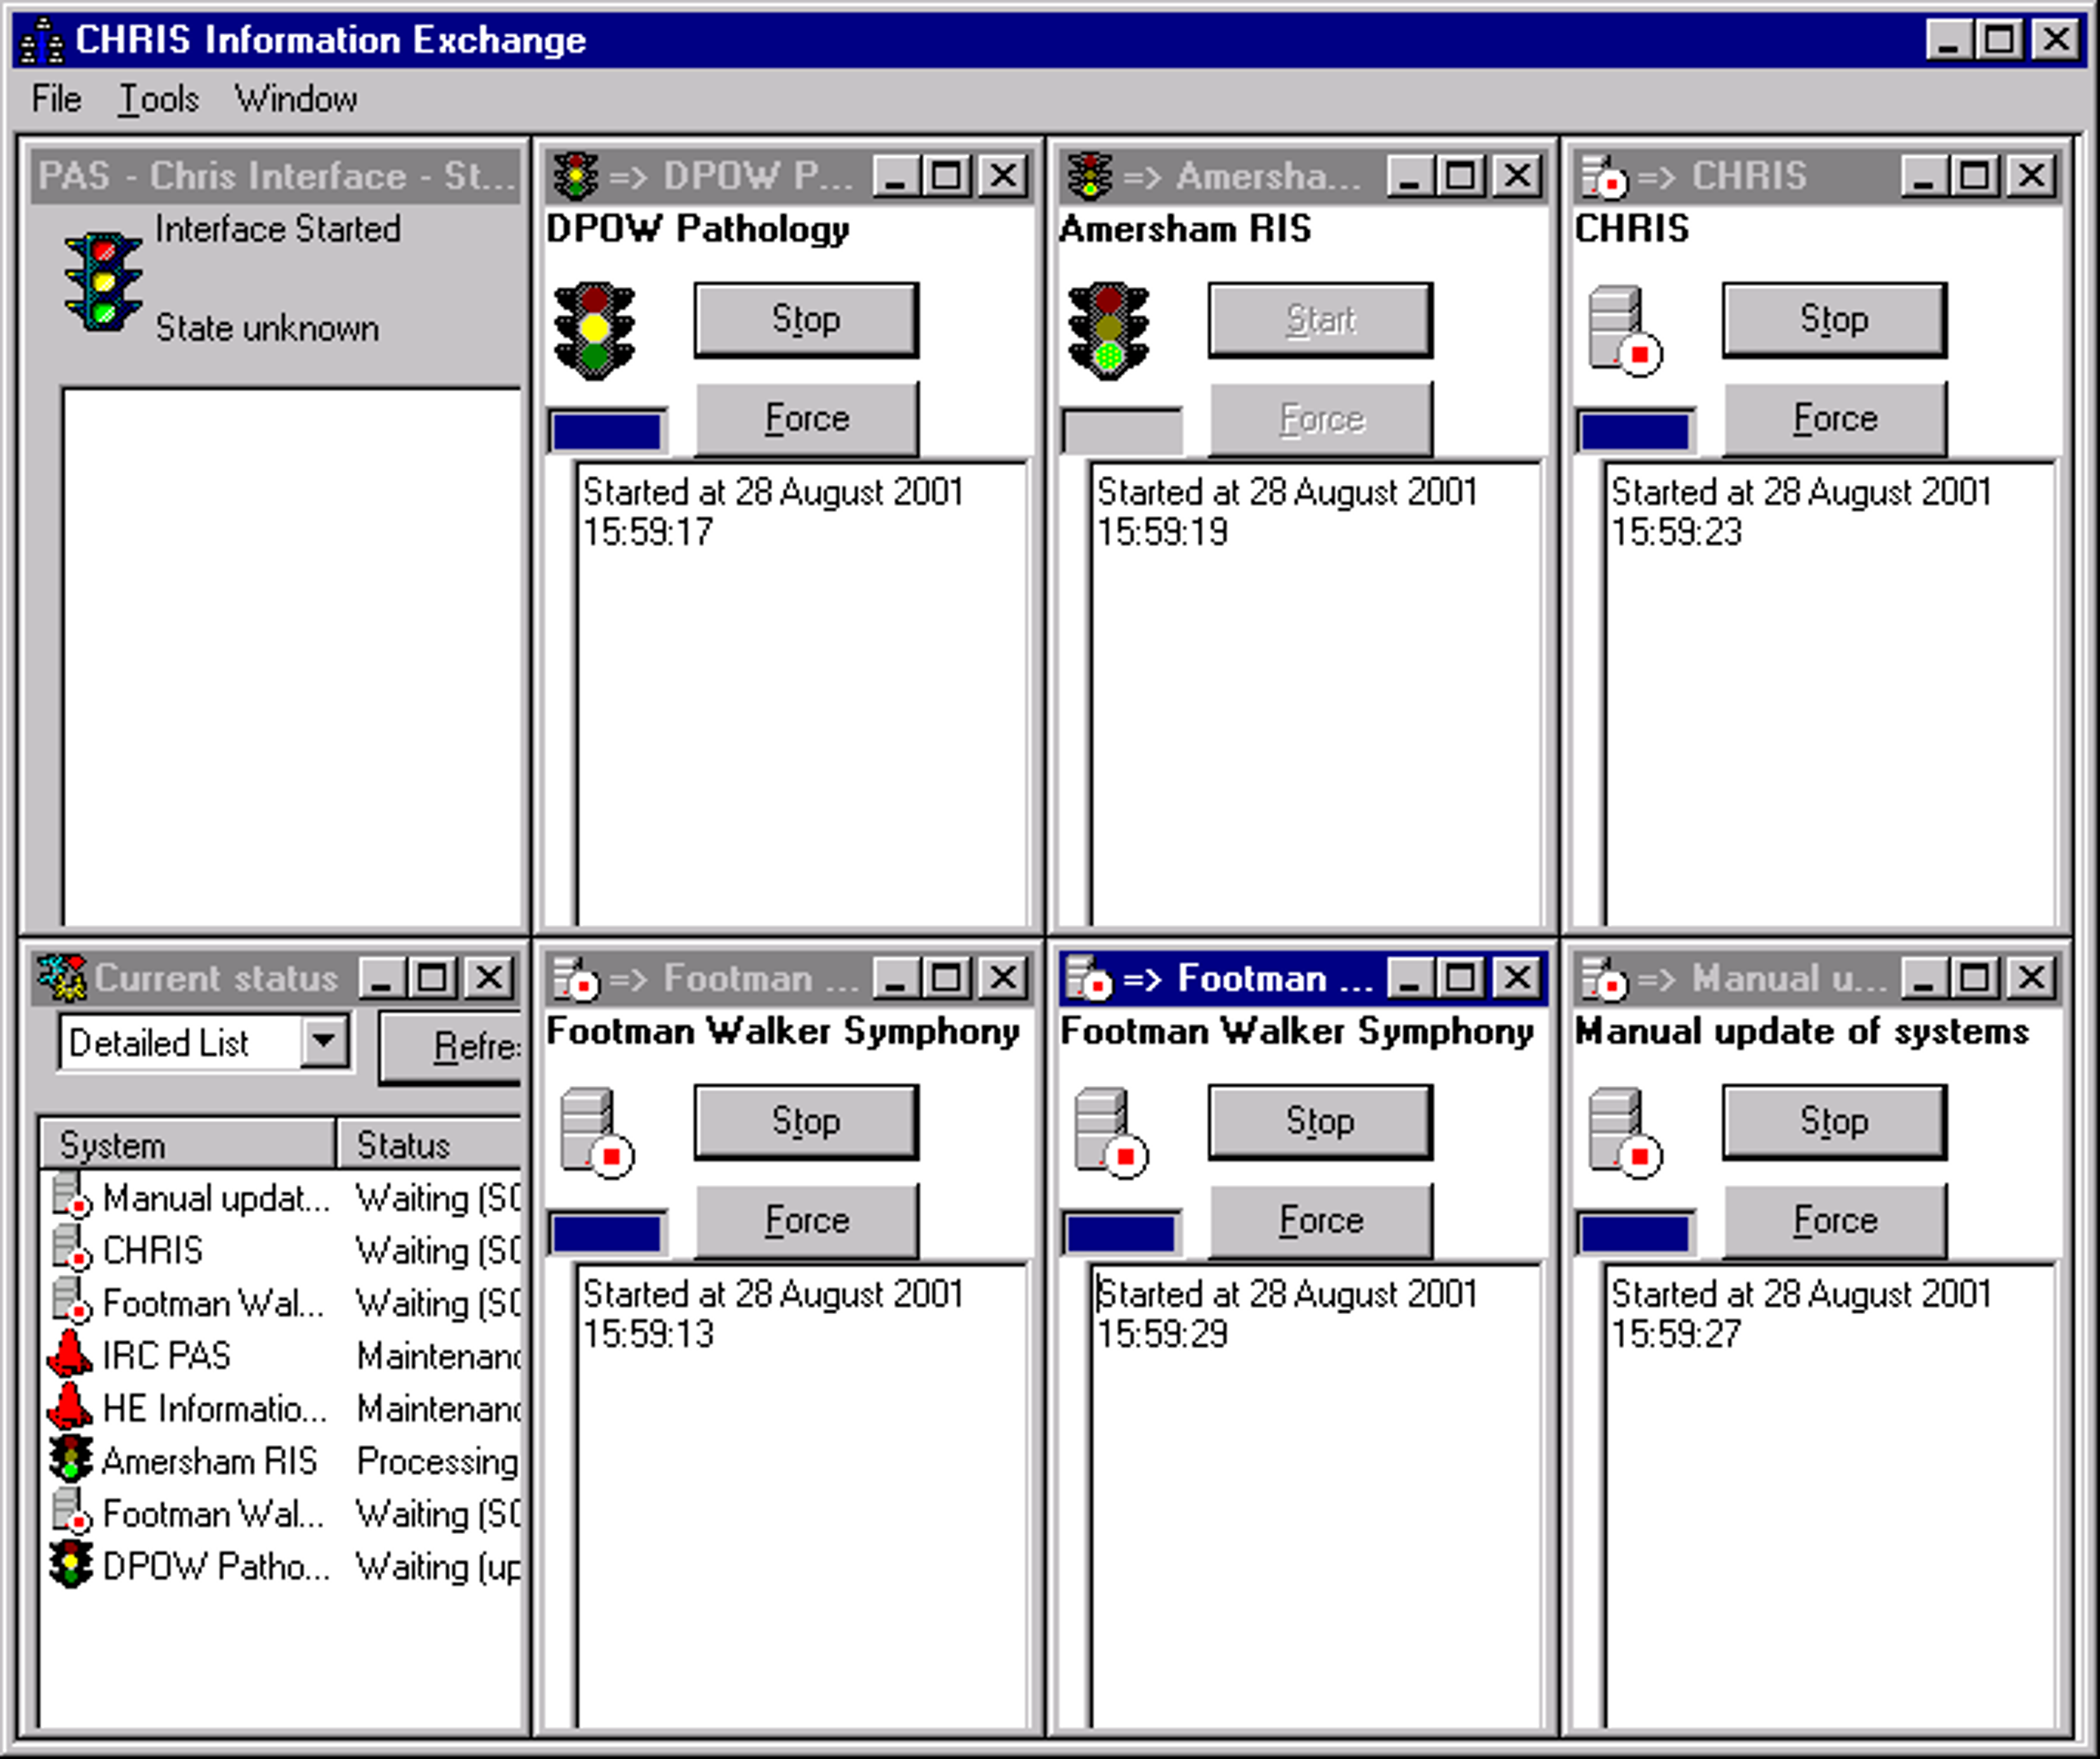
Back in 2000, I worked with colleagues at Scunthorpe and Goole Hospitals to create a summary of coded entries. The data model was simple – a simple header with basic demographics accompanied by a journal of dated contacts and the description of the journal entry. The descriptions were all from the Clinical Terms Version 3 (CTV3) entries in our casemix data warehouse. Significantly, the warehouse was fed from many data sources. The homespun interface engine (user interface above) was fully model driven, enabling flexible mapping from the various data sources from three NHS trusts into a canonical model. Those sources were:
- The Inter Regional Consortium Patient Administration (Scunthorpe and Goole). Interfacing though what we now call event steaming with a bespoke set of messages encoded in “Ilkley Moor” format (bars, hats and tilde) with the exception of waiting list data which used a daily batch feed
- Hospital Engineering CAMIS Patient Administration System. Interfacing though HL7 V2 messages also encoded in “Ilkley Moor” format.
- Symphony Emergency Care from Footman Walker (configured to collect CTV3 codes)
- HICOM Diamond diabetes register with a complex set of routines to convert a myriad of database specific data types into CTV3. This was one of the most complex interfaces since the data model reflected the user interface. The application created a normalised representation in SQL Server, with stored procedures to transfer to the data warehouse.
- Amersham Healthcare Radiology Information System. Interfacing though HL7 V2 messages also encoded in “Ilkley Moor” format.
- Medicode clinical coding directly into CTV3 with maps to ICD-10 and OPCS4. The data were stored direct to the data warehouse.
- Fountain pathology used at Diana Princess of Wales Hospital in Grimsby.
- In-house maternity, direct into SQL Server, with stored procedures to transfer to the data warehouse.
- In-house theatre register, again direct into SQL Server, with stored procedures to transfer to the data warehouse.
Each of the journal entries was tagged with a “type” used to create some headings. The eventual summary journal entries looked similar to this synthetic example, taken from a presentation I made at the Institute of Directors in 2001:
Admitted (DGH2) on 19 Mar 1996 under Dr GD L – Oesophagus – Diagnostic Procedures
Diagnoses: Reflux oesophagitis; Diaphragmatic hernia NOS;
Procedure: Fibreoptic Endoscopic examination of upper gastrointestinal tract and biopsy of lesion of upper gastrointestinal tract;
Symptoms: Epigastric pain; Anorexia symptoms
Waiting list (DGH2) from 18 Jul 2000 to 18 Oct 2000 under Mr JP M – GASTROSCOPY / DILATATION
Procedure: Gastroscopy;
Accident/Emergency (DGH1) on 11 Feb 2001 under Unspecified Clinician – Accident and Emergency
Diagnoses: Diagnosis not made;
Procedure: Application of Splint; Guidance; Dressing
Other Details: Self-referral; has other personal transport; Place of occurrence of accident or poisoning, home;
A summary EHR and Shared Information System in use – Over 2 years experience of combining and reporting patient-level data from multiple operational systems – presentation at Institute of Directors June 28, 2001.
Reflection
Looking back, this summary proved to be useful. It showed activity from different systems in different organisations in a simple form. This summary took data from two of the three forms I called out in So what does it all mean? – part 4 – Electronic records, used an ontology (CTV3) to normalise the semantics and made the content available. It wasn’t a complete canonical electronic health record, but it was good enough for the job at hand.
The 2001 example doesn’t have the finesse of the International Patient Summary (see My record for me to use and share), doesn’t adopt a problem orientation (see Revisiting Larry Weed) and doesn’t include GP data, but it was much clearer to read than the GP summary I have available from SystmOne though the NHS App.
The interface in 2001 looks dated. The coding in Visual Basic 6 achieved multi-threading by spawning sub-processes of a common application rather than containing in a single application, and the “model driven” conversions were managed with a set of mapping tables rather than the visual interfaces available today,
Going forward
If I knew then what I know now, I may have had a different design. Looking forward, the International Patient Summary provides a strong basis for progress. It comes with a sensible structure so that the key information is easily digested, easy to share and can be held by the patient on a device of their choosing. This matters – back in January 2013 I met colleagues in the Office of the National Coordinator (US Department of Health and Human Services ) and concluded patient mediated portability is critical for cross-border health care.
Acknowledgements:
I’d like to thank my colleague then and now, Cath Chilcott, for her support in developing this part of the What does it all mean? series.